Profile of the Running ES Score & Positions of GeneSet Members on the Rank Ordered List
| Dataset | Set_03_absentNotch_versus_wtNotch.phenotype_absentNotch_versus_wtNotch.cls #wtNotch_versus_absentNotch |
| Phenotype | phenotype_absentNotch_versus_wtNotch.cls#wtNotch_versus_absentNotch |
| Upregulated in class | wtNotch |
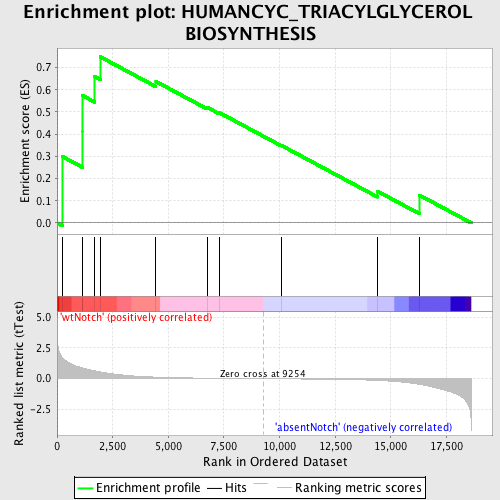
| GeneSet | HUMANCYC_TRIACYLGLYCEROL BIOSYNTHESIS |
| Enrichment Score (ES) | 0.74817497 |
| Normalized Enrichment Score (NES) | 1.4301761 |
| Nominal p-value | 0.08113591 |
| FDR q-value | 0.6571255 |
| FWER p-Value | 1.0 |
| PROBE | DESCRIPTION (from dataset) | GENE SYMBOL | GENE_TITLE | RANK IN GENE LIST | RANK METRIC SCORE | RUNNING ES | CORE ENRICHMENT | |
|---|---|---|---|---|---|---|---|---|
| 1 | AGPAT2 | 6110592 | 251 | 1.697 | 0.2984 | Yes | ||
| 2 | AGPAT3 | 60152 | 1138 | 0.881 | 0.4128 | Yes | ||
| 3 | AGPAT4 | 6040079 | 1140 | 0.878 | 0.5740 | Yes | ||
| 4 | DGAT1 | 1850538 | 1693 | 0.630 | 0.6602 | Yes | ||
| 5 | AGPAT1 | 610056 | 1942 | 0.551 | 0.7482 | Yes | ||
| 6 | PPAP2B | 3190397 4730280 | 4441 | 0.127 | 0.6372 | No | ||
| 7 | PPAP2A | 1170397 3440288 3930270 | 6744 | 0.040 | 0.5208 | No | ||
| 8 | MOGAT1 | 5900091 | 7279 | 0.030 | 0.4976 | No | ||
| 9 | GPAM | 1740180 | 10084 | -0.012 | 0.3490 | No | ||
| 10 | PPAP2C | 2970348 | 14403 | -0.140 | 0.1426 | No | ||
| 11 | DGAT2 | 5130685 | 16278 | -0.456 | 0.1257 | No |

